Measure one variable
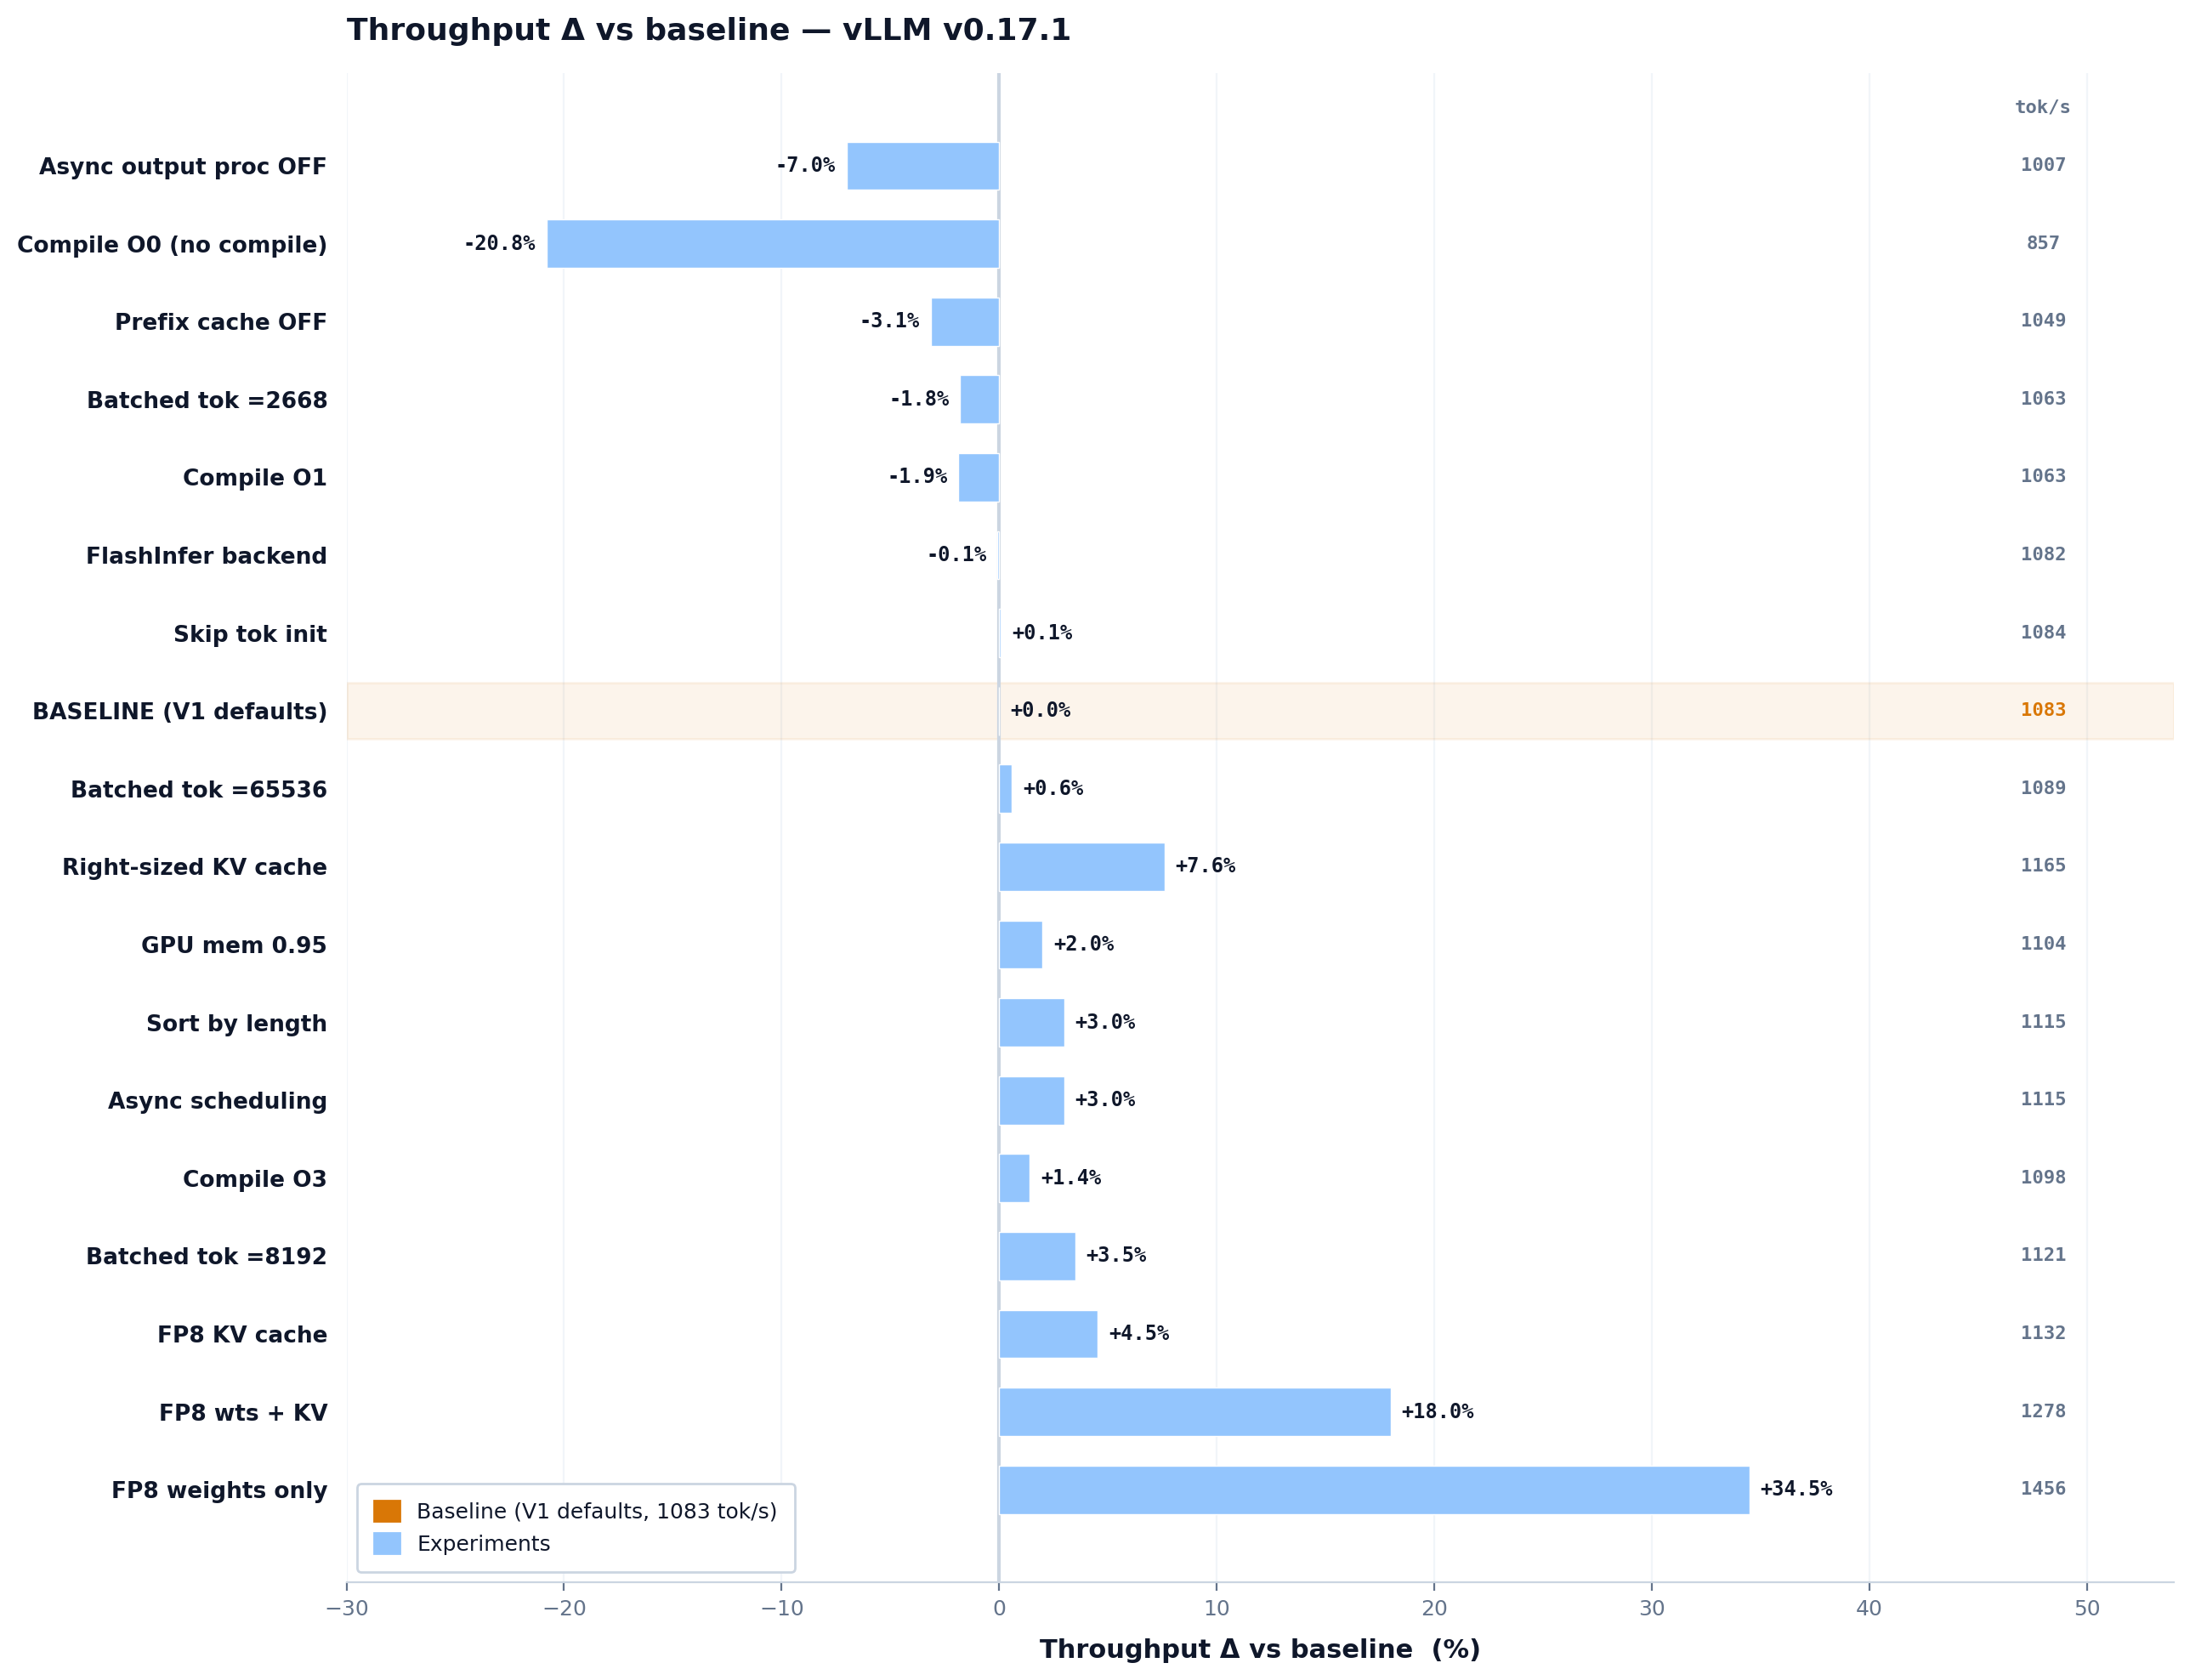
The isolation sweep changes one engine setting from the BF16, batch 16 baseline. This makes regressions attributable.
ML systems and GPU profiling
This project began with a practical question: how much more work can one GPU do when the hardware stays fixed? I built a reproducible MLPerf Offline harness, changed one vLLM setting at a time, checked output quality with ROUGE, and used Nsight Systems to explain the results at the kernel and batch level.
The question
A throughput number by itself can hide truncation, shorter generations, invalid LoadGen behavior, or a quality regression. The benchmark therefore treats performance and accuracy as paired measurements. Every promising setting has to survive both.
The isolation sweep changes one engine setting from the BF16, batch 16 baseline. This makes regressions attributable.
A second sweep combines the strongest candidates and records where interactions erase an apparent gain.
ROUGE scores, generation length, and MLPerf validity decide whether a faster result can be called safe.
Experimental system
| Model | Meta Llama 3.1 8B Instruct |
|---|---|
| Workload | MLPerf Offline summarization on the CNN and DailyMail evaluation set |
| GPU | NVIDIA H200 NVL, 71 GB MIG instance, driver 570.133.20 |
| Host | Dual Intel Xeon Platinum 8480+, 224 virtual CPUs, 256 GB RAM |
| Runtime | vLLM 0.17.1 with PyTorch 2.10.0 and CUDA 12.8 or 12.9 components |
| Baseline | BF16 weights, tensor parallel size 1, batch size 16, stock vLLM V1 defaults |
Method
Nineteen settings covered quantization, scheduling, compilation, cache size, memory utilization, attention backends, tokenizer setup, and request ordering. Each run started from the same production baseline.
FP8 weights, a right sized context window, input length sorting, cache formats, compilation levels, and allocator behavior were added progressively. The sweep exposed settings that looked useful alone but hurt in combination.
Separate accuracy runs measured ROUGE 1, ROUGE 2, ROUGE L, and total generated tokens. Negative controls deliberately changed context and output limits to confirm that the checks could catch bad configurations.
NVTX ranges and Nsight Systems traces compared batch 16 with batch 1024. SQL analysis of the trace databases quantified kernel mix, active time, and the delay between batches.
Single variable results
The baseline produced 1,082.82 tokens per second. FP8 weight quantization reached 1,456.36 tokens per second, a 34.5 percent gain. Right sizing the model context to 2,668 tokens added 7.6 percent and remained accuracy neutral. Turning compilation off was the worst isolated change, cutting throughput by 20.8 percent.
| Change | Tokens per second | Delta | Interpretation |
|---|---|---|---|
| FP8 weights | 1,456.36 | +34.50% | Best isolated nonbatch gain |
| Context length 2,668 | 1,165.24 | +7.61% | Accuracy neutral and safe |
| Async scheduling | 1,115.30 | +3.00% | Small measured gain |
| FP8 weights and FP8 KV | 1,277.73 | +18.00% | KV quantization erased part of the weight gain |
| No compilation | 857.43 | −20.82% | Compilation is necessary for this stack |
| bitsandbytes in the stack | 446.14 | −59.03% | Not competitive with native FP8 |
Memory and context
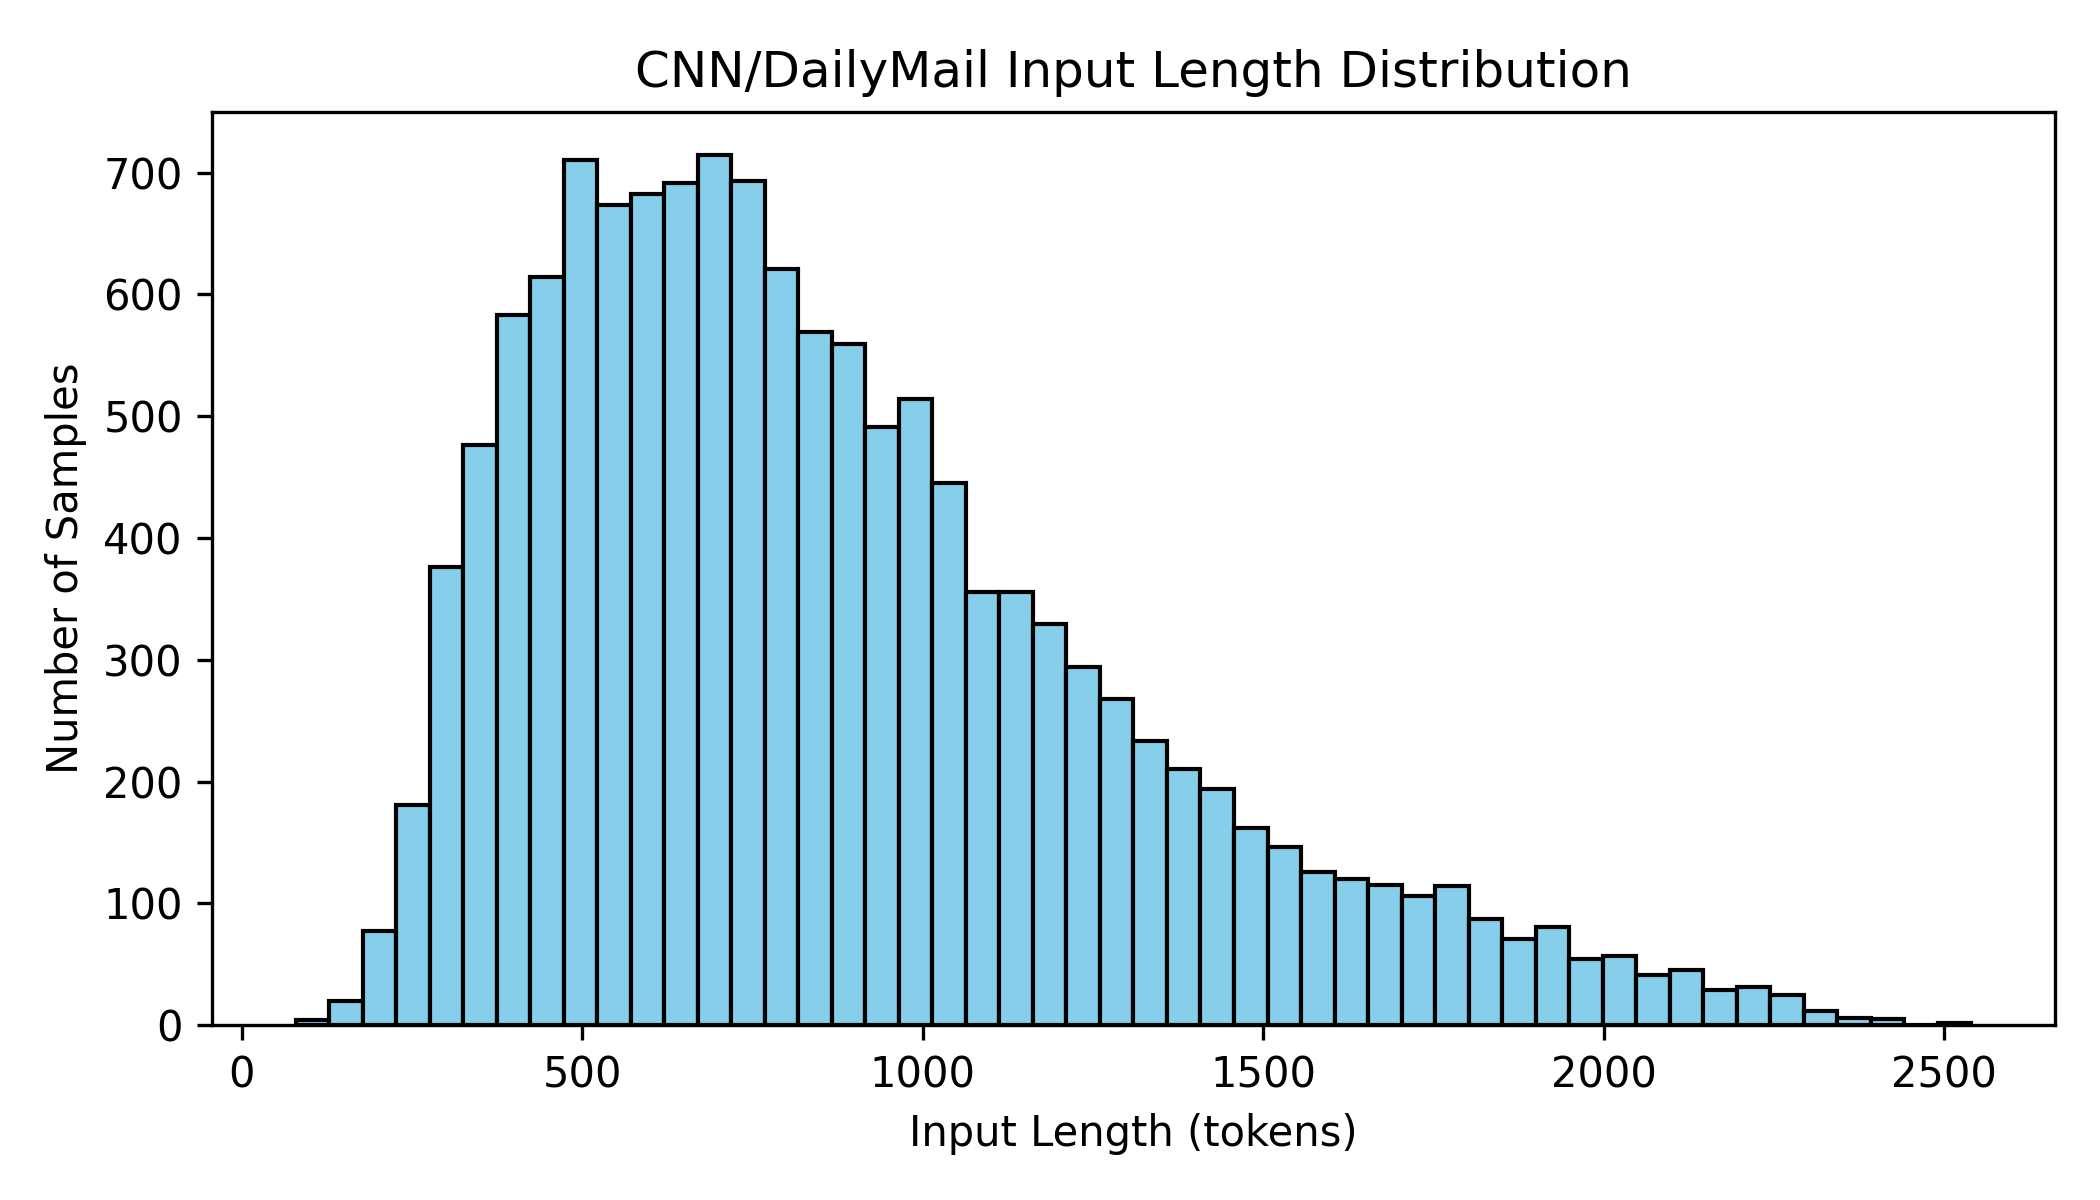
The dataset reaches roughly 2,540 input tokens and permits 128 output tokens. A 2,668 token context therefore covers the full workload while avoiding KV cache allocation for unused context. At 1,500 tokens, ROUGE 1 dropped by 2.24 points because inputs were truncated. A 1,000 token run failed. The smaller window only becomes a valid optimization after it covers the data.
Stacked optimization
FP8 weights followed by the 2,668 token context reached 1,544.29 tokens per second, 41.8 percent above the 1,089.04 token per second stack baseline. Later additions did not improve it. Input sorting, FP8 KV cache, compilation level 3, and expandable allocator segments each reduced throughput in this combination.
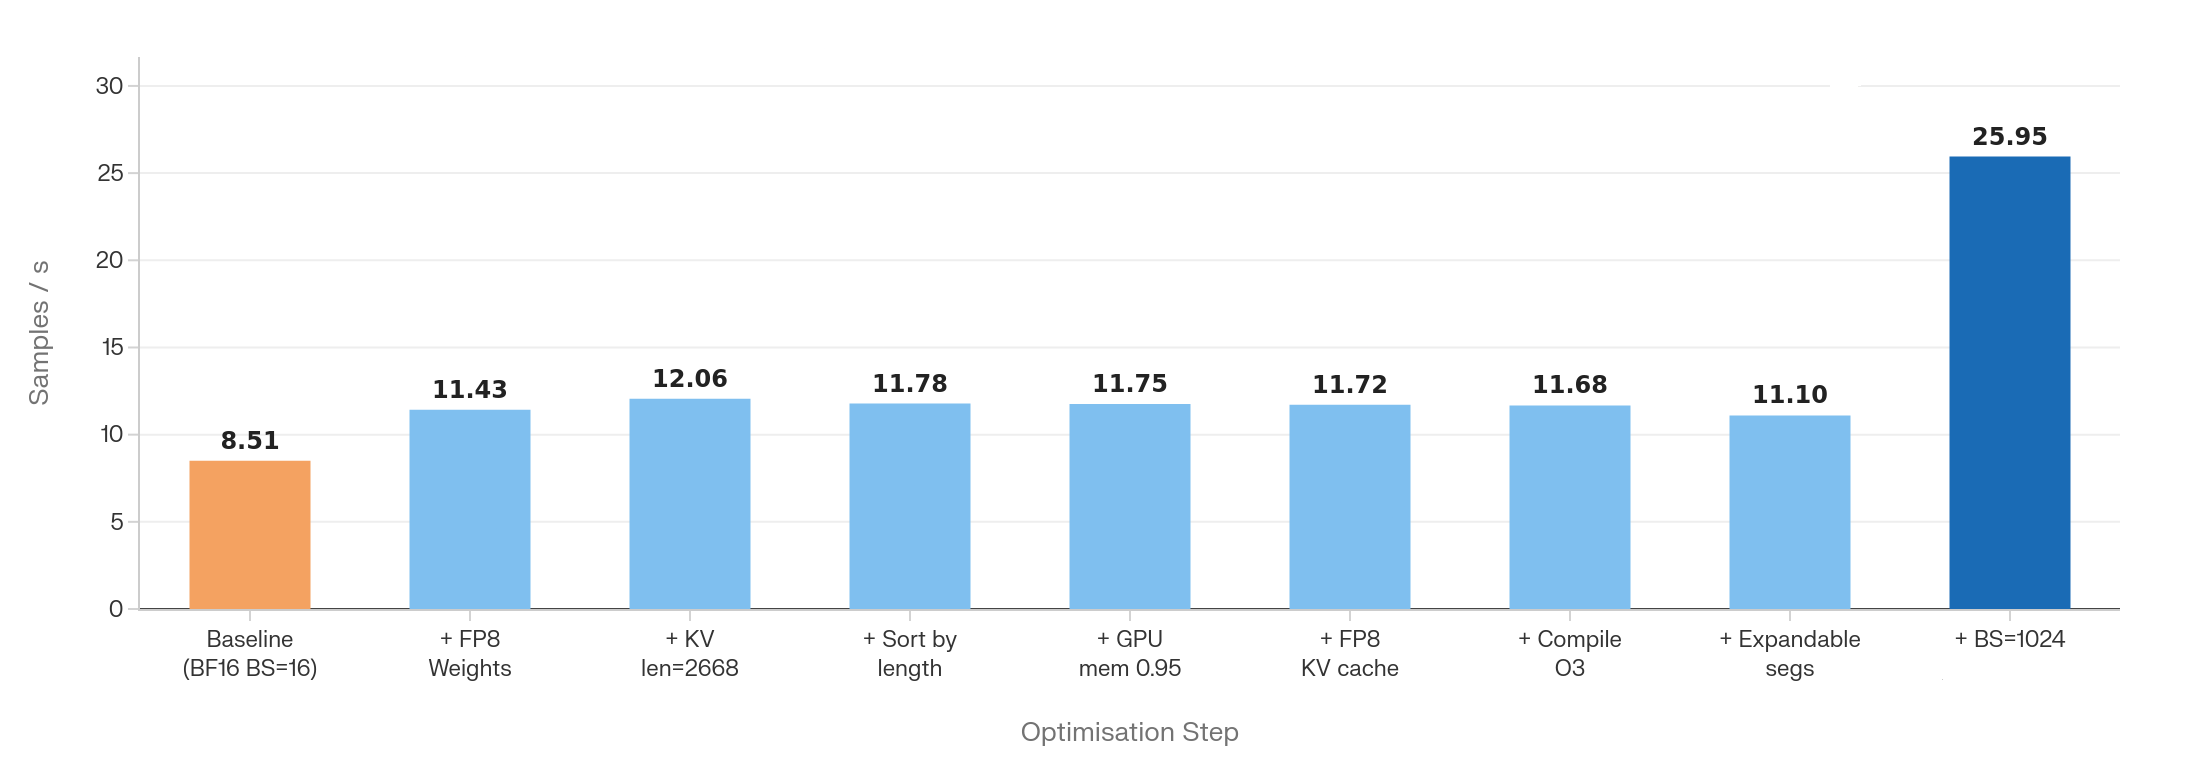
Batch 1024 reached a 205 percent gain in the stacked study, but that run was not valid for certification. Separate large batch accuracy runs also showed about a 13 point ROUGE 1 loss, while a later combined run recovered ROUGE. Until the LoadGen issue and batch dependent output behavior are reconciled, the number is useful engineering evidence, not a ship claim.
Accuracy
The measured BF16 control scored 38.80 ROUGE 1, 15.95 ROUGE 2, and 24.52 ROUGE L. The 2,668 token context matched it within 0.001. Large standalone batch runs did not: batch 512 scored 26.21 ROUGE 1 and batch 1024 scored 25.57.
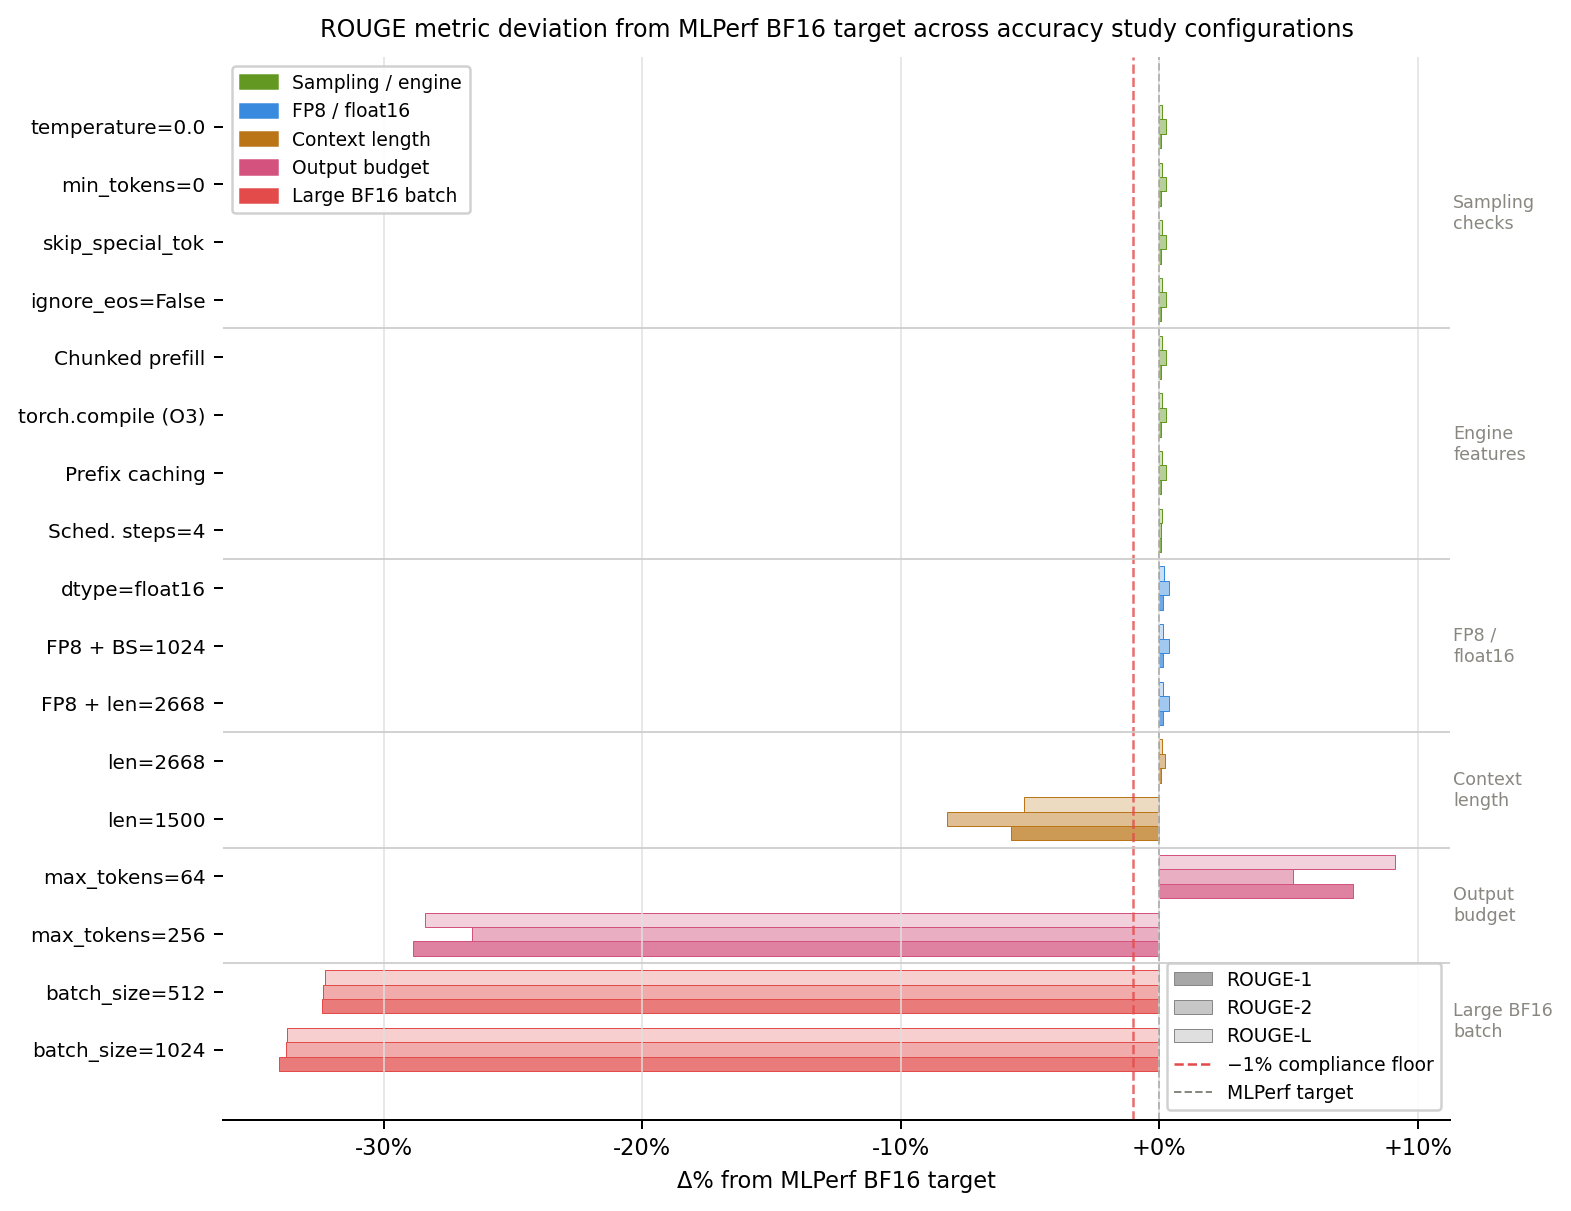
max_model_len=2668 preserved the full input range and
matched baseline ROUGE. It is the clearest production
recommendation.
FP8 plus batch 1024 later scored 38.8375 ROUGE 1, but the isolated large batch failures mean the interaction still needs a controlled rerun.
Nsight Systems
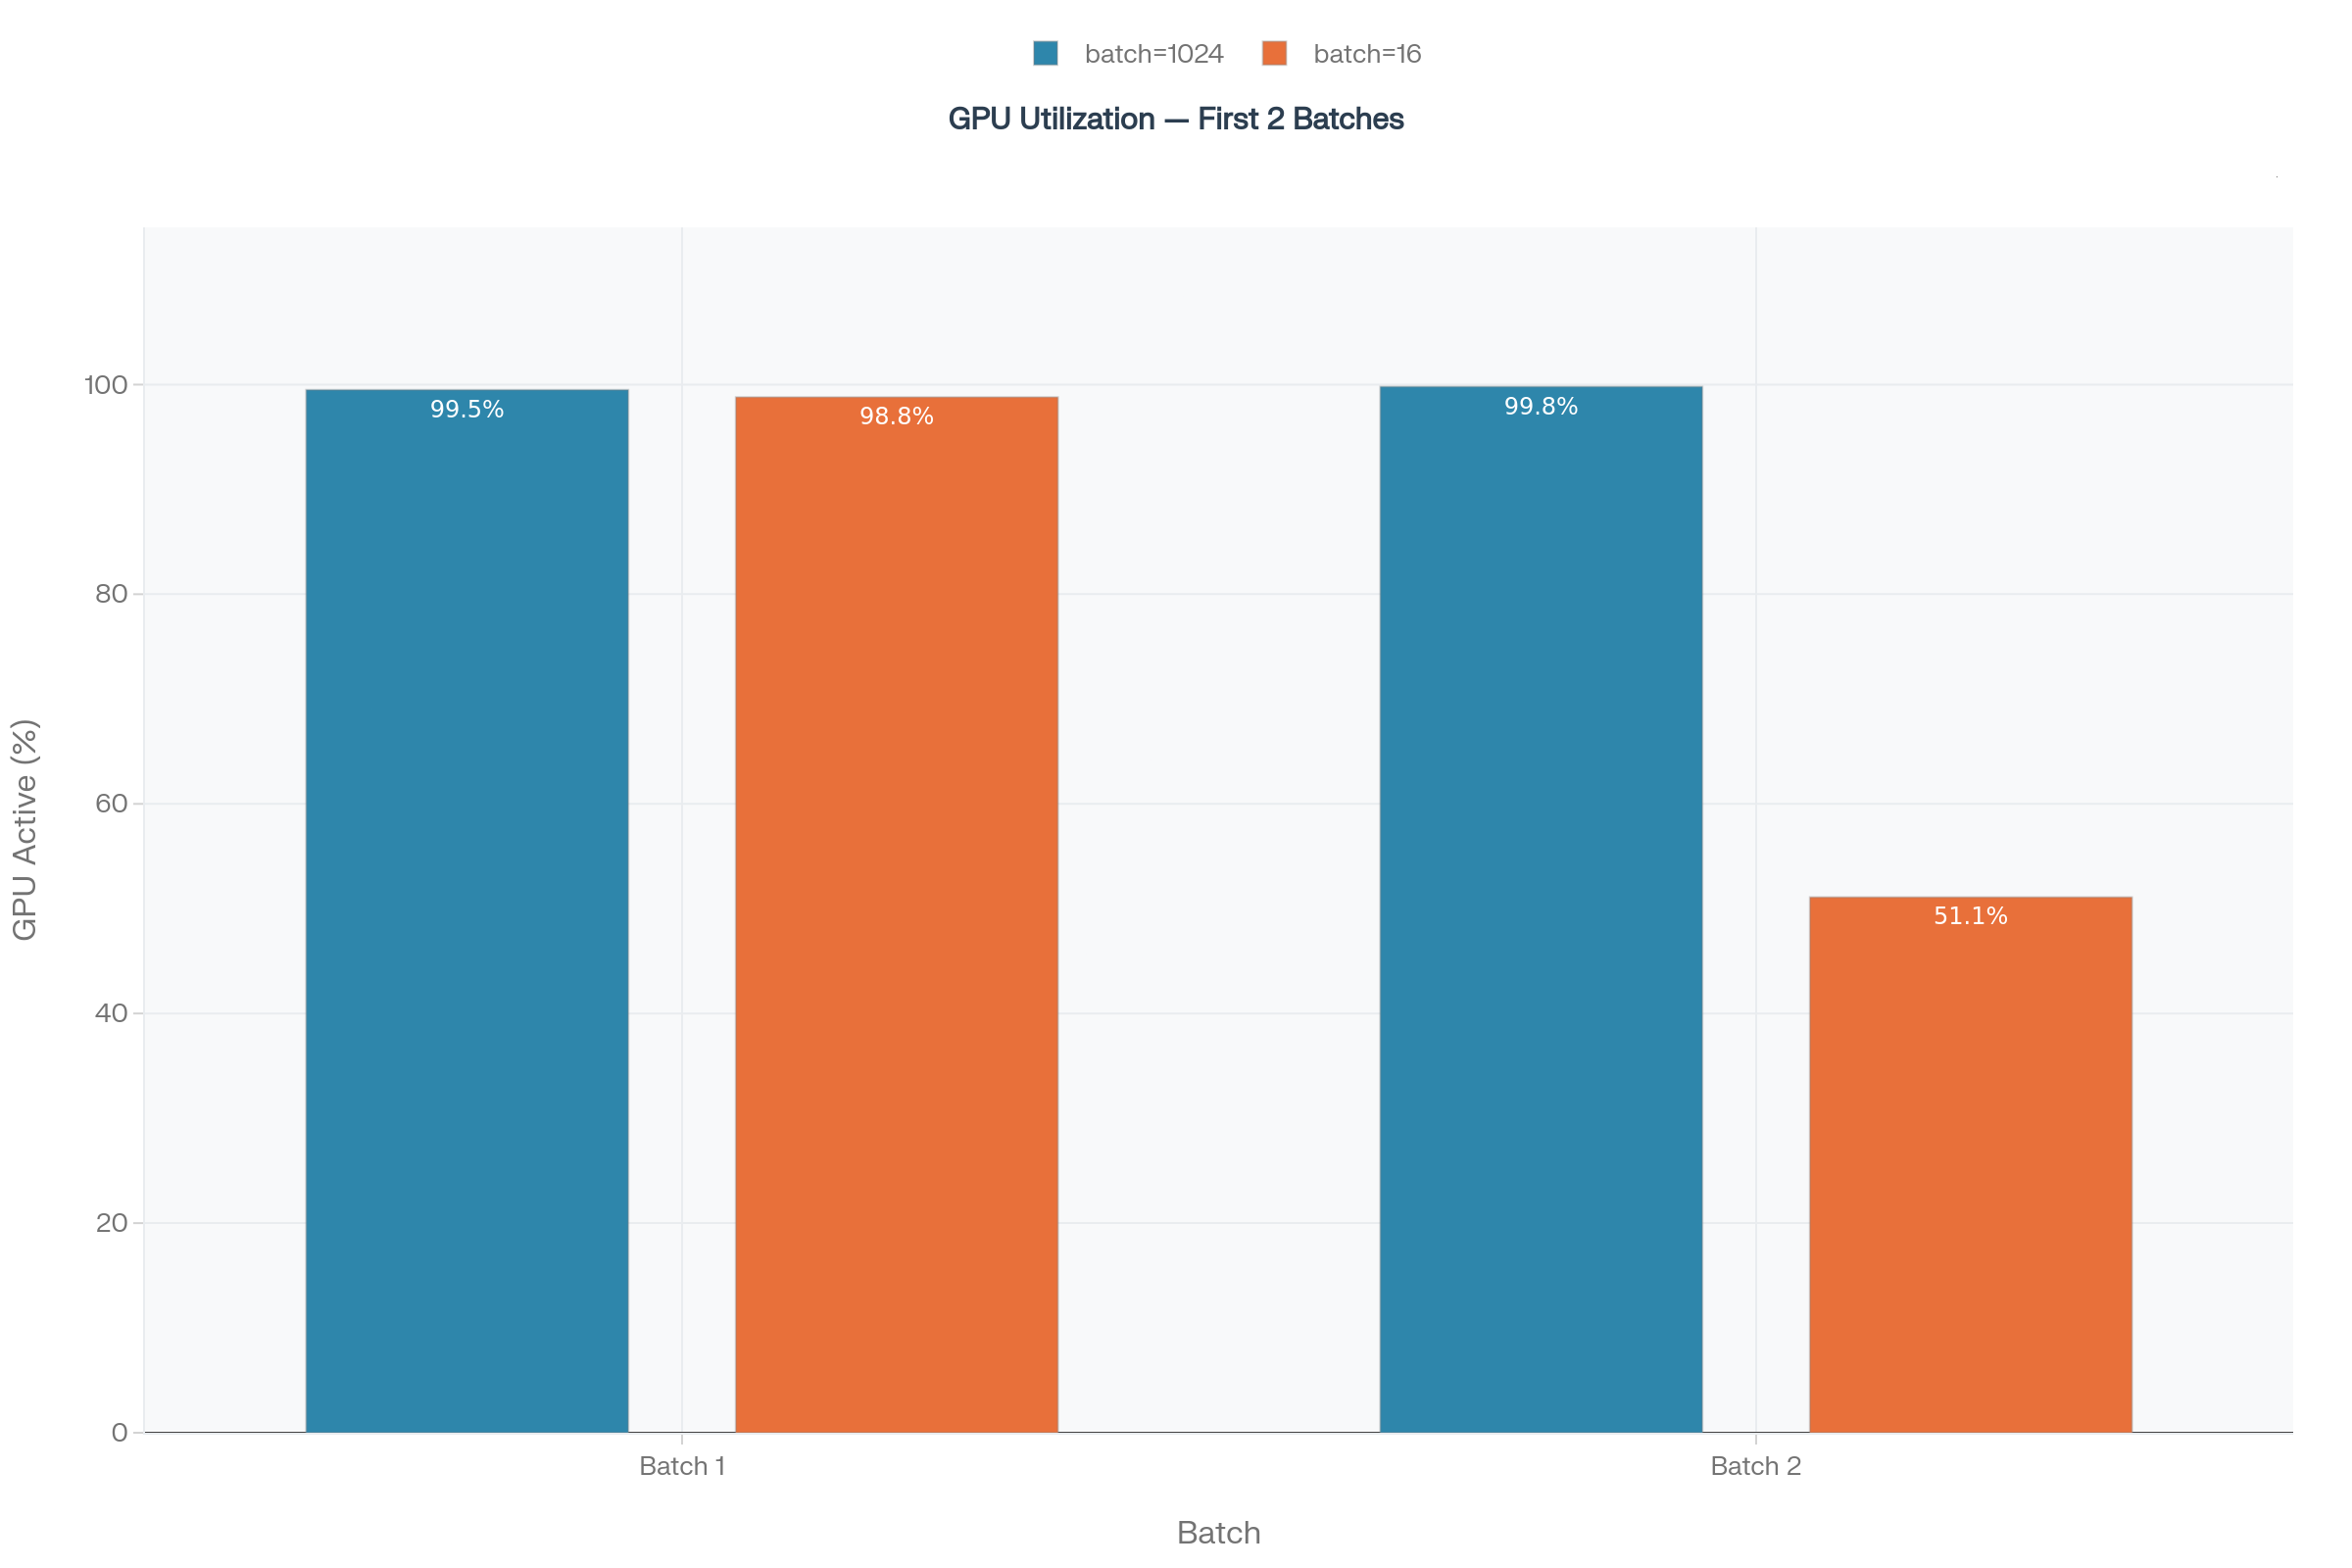
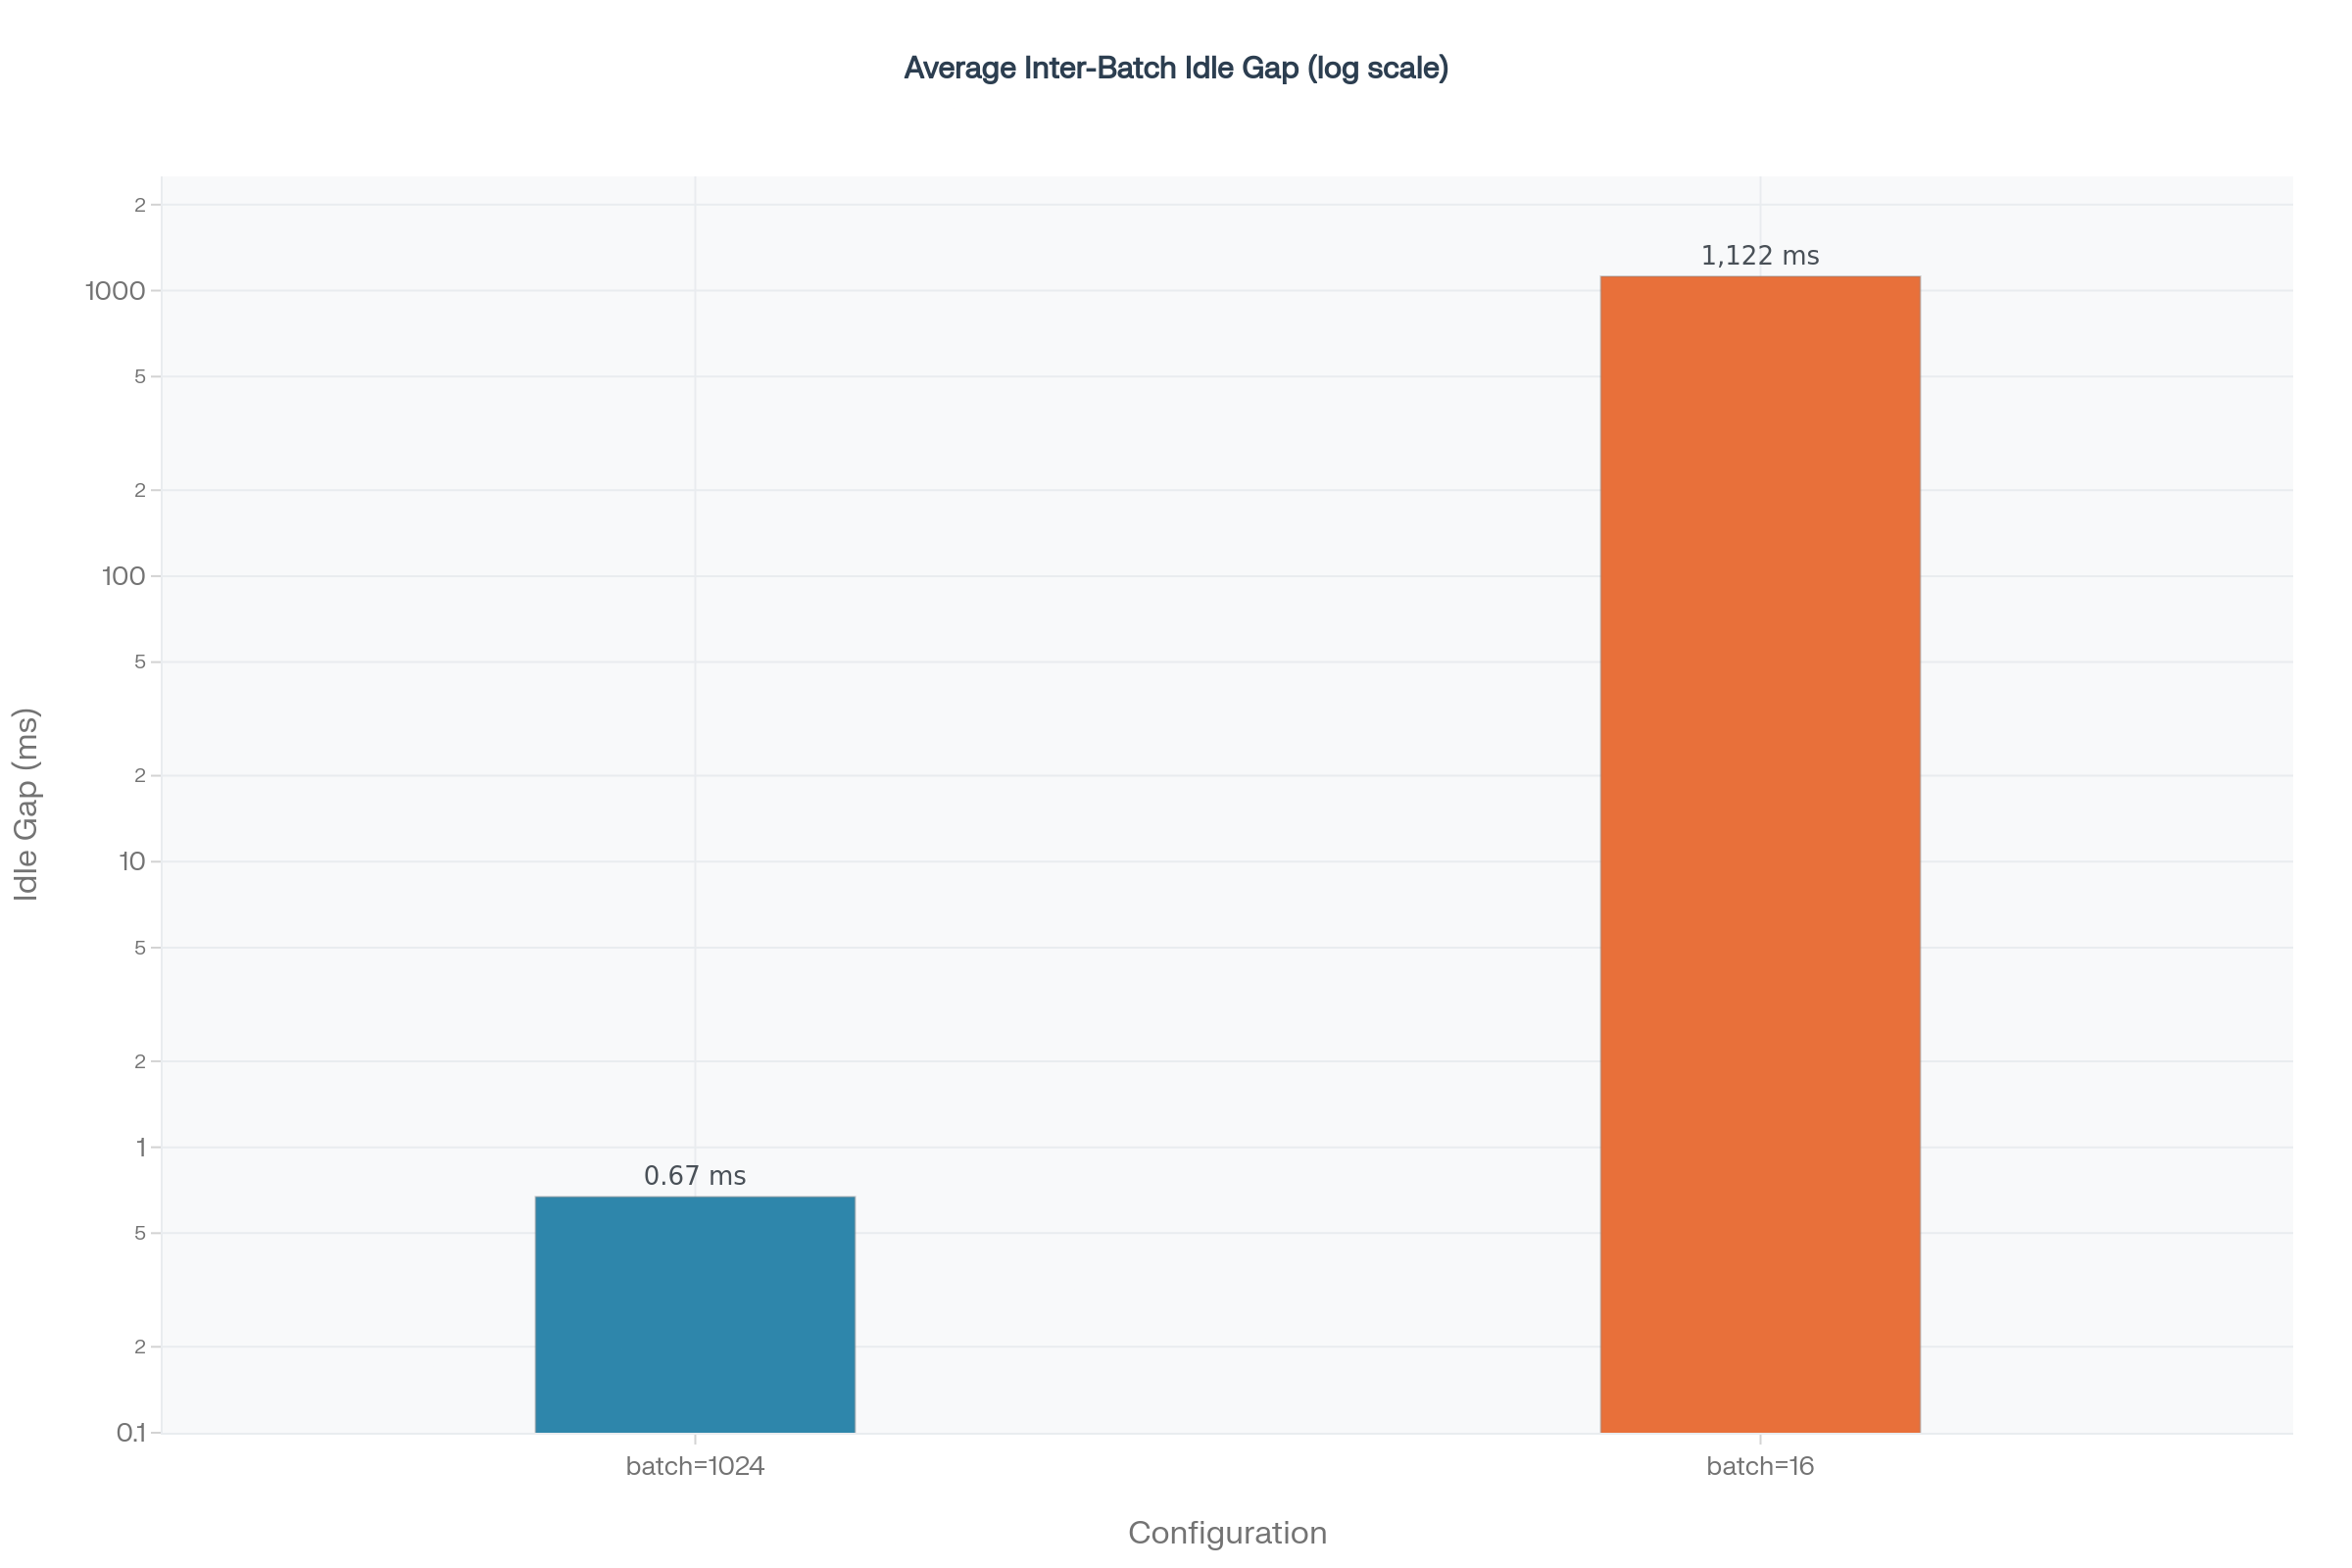
Both traces spent most active GPU time in GEMM kernels, but active time tells only half the story. Batch 16 averaged a 1,122 ms idle gap between batches and used the GPU for roughly half of elapsed batch time. Batch 1024 reduced the gap to 0.516 ms and kept utilization between 99.5 and 99.8 percent. The difference is 2,174 times.
| Trace metric | Batch 16 | Batch 1024 |
|---|---|---|
| Average interbatch gap | 1,122 ms | 0.516 ms |
| GPU utilization | 51.0 to 51.4% | 99.5 to 99.8% |
| GEMM share of active time | 90.9% | 95.1% |
| FlashAttention share | 1.2% | 1.6% |
What I learned
FP8 reduces weight traffic enough to matter on a decode heavy workload, but KV quantization adds overhead and does not repeat the same win.
Large batches remove CPU dispatch bubbles and increase arithmetic intensity. They also alter generation behavior, so quality must be checked again.
Disabling compilation, async output processing, or prefix caching reduced performance. A tuning sweep should test defaults, not assume they are waste.
Reproducibility
Run scripts record the experiment ID, engine parameters, MLPerf logs, latency summaries, SUT snapshot, and metrics. Throughput, accuracy, and profiling artifacts live in separate folders so a result can be traced back to the exact path that produced it.
make run-isolation
make run-stacked
make run-accuracy
make profile-16
make profile-1024